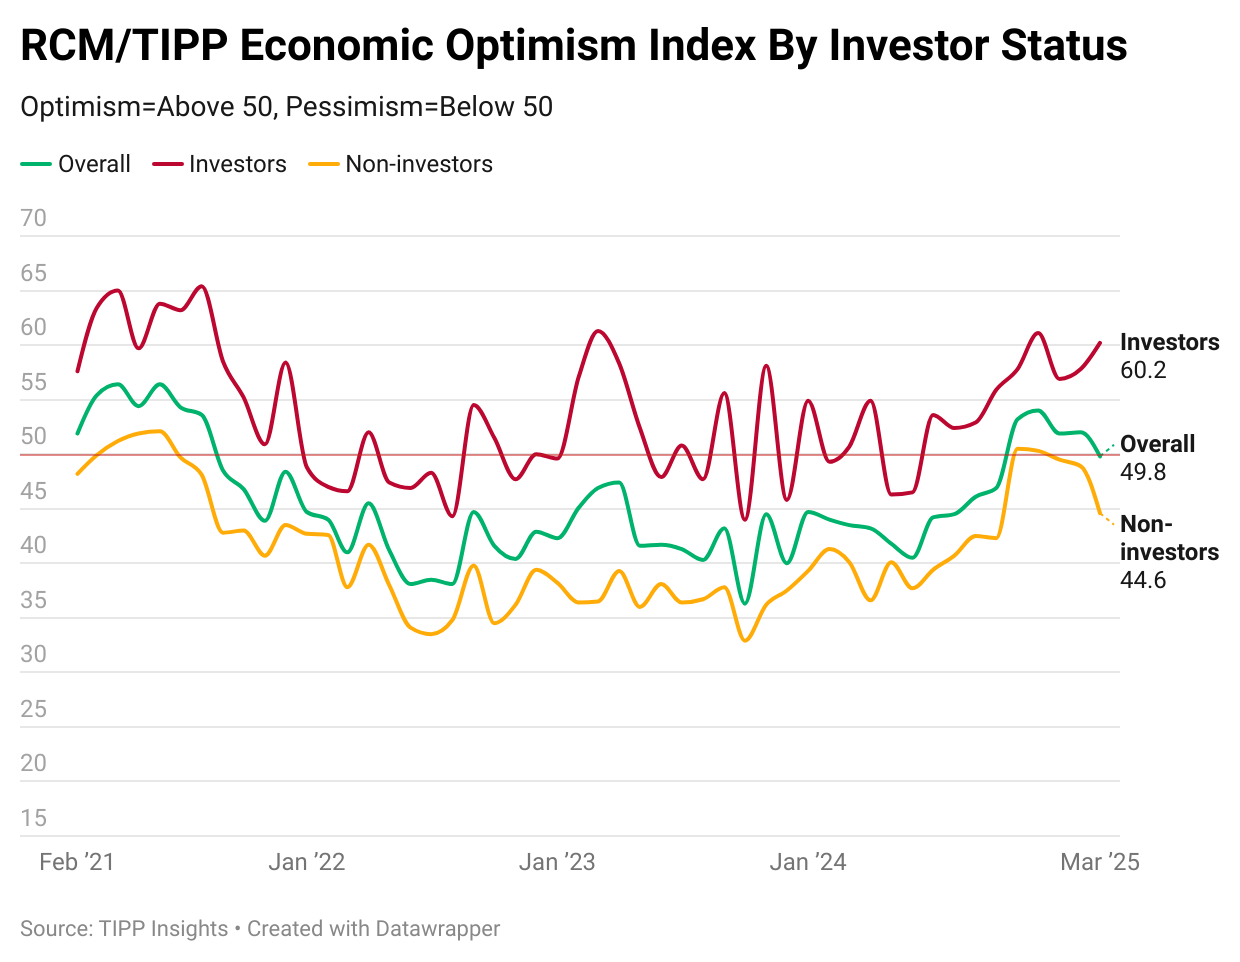
Investors remain upbeat while non-investors grow more gloomy.
The RealClearMarkets/TIPP Economic Optimism Index, a key gauge of consumer sentiment, fell from 52.0 in February to 49.8 in March, a 4.2% drop. After hitting a 40-month high of 54.0 in December, it edged down to 51.9 in January and 52.0 in February. Since President Trump’s re-election in November 2024, the Index has stayed in optimistic territory but slipped below the 50.0 threshold in March.
March’s reading of 49.8 is 1.3% higher than its historical average of 49.2.
The RCM/TIPP Economic Optimism Index is the first monthly measure of consumer confidence. It has established a strong track record of foreshadowing the confidence indicators issued later each month by the University of Michigan and The Conference Board. (From February 2001 to October 2023, TIPP released this Index monthly in collaboration with its former sponsor and media partner, Investor’s Business Daily.)
RCM/TIPP surveyed 1,434 adults from February 26 to 28 for the March index. The online survey utilized TIPP’s network of panels to obtain the sample. A more detailed methodology is available here. The Index ranges from 0 to 100. Readings above 50 indicate optimism, while those below 50 signal pessimism. A score of 50 is neutral.
RCM/TIPP Economic Optimism Index
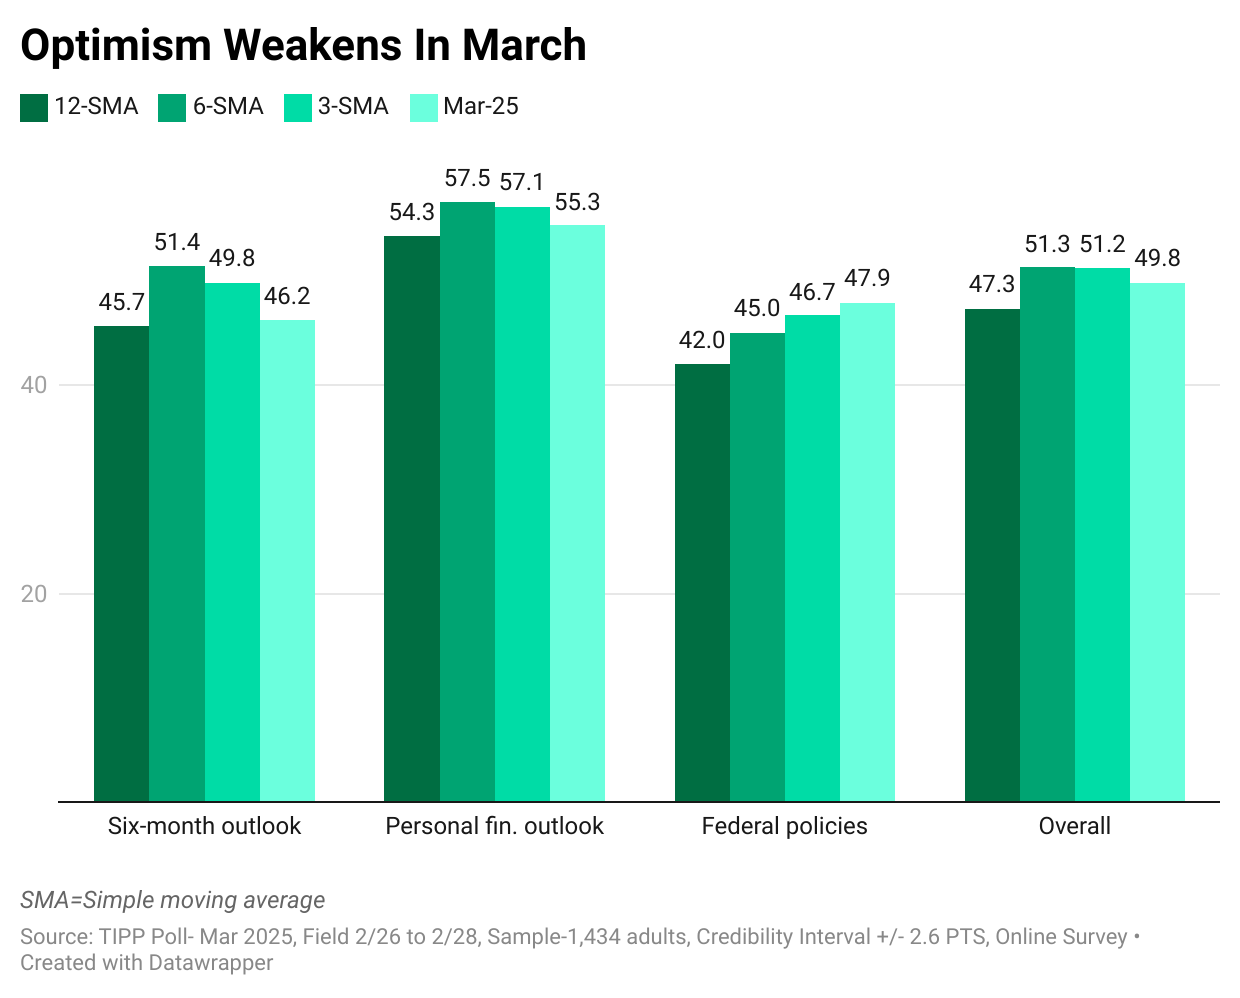
The RCM/TIPP Economic Optimism Index has three key components. In March, all three components declined.
- The Six-Month Economic Outlook, which measures how consumers perceive the economy’s prospects in the next six months, declined by 9.6%, from 51.1 in February to 46.2 in March, breaking a four-month positive streak.
- The Personal Financial Outlook, a measure of how Americans view their own finances in the next six months, dropped by 1.3% from its previous reading of 56.0 in February to 55.3.
- Confidence in Federal Economic Policies, a proprietary RCM/TIPP measure of views on the effectiveness of government economic policies, declined from 48.8 in February to 47.9 this month, reflecting a 1.8% drop. This component has been below 50.0 in the pessimistic territory for 43 consecutive months since September 2021.
Party Dynamics
With Donald Trump’s election as the 47th President, Democrats’ confidence tumbled from 62.9 in October to 43.2 in November. However, it increased in December to 47.6. It dropped again in January to 45.7. It further declined to 37.5 in February and 32.3 this month.
Meanwhile, Republicans’ confidence skyrocketed from 34.8 in October to 64.7 in November. It has improved from 69.0 in February to 70.9 this month.
In November, independent voters’ confidence rose by 8.6 points, or 20%, to 51.3. (The Index posted its first positive reading in nearly five years after remaining in pessimistic territory for 56 months, beginning in April 2020, shortly after the onset of the pandemic). In March, it dropped from 47.0 in February to 43.8.
Investor Confidence
Respondents are considered “investors” if they currently have at least $10,000 invested in the stock market, either personally or jointly with a spouse, either directly or through a retirement plan. Three in ten (29%) of respondents met this criterion, and 64% were classified as non-investors. We could not ascertain the status of seven percent of respondents.
Investor confidence improved by 4.2% (2.4 points) to 60.2, while non-investor confidence dropped sharply by 4.3 points (8.8%) to 44.6.
Momentum
Comparing a measure’s short-term average to its long-term average is one way to detect its underlying momentum. For example, if the 3-month average is higher than the 6-month average, the indicator is bullish; similarly, if the 6-month average exceeds the 12-month average, the same holds.
In March, the Economic Optimism Index, along with the Six-Month Outlook and Personal Financial Outlook, dipped slightly below their three-month moving averages, suggesting a modest slowdown in sentiment.
The Federal Policies component, however, continued to rise, signaling growing confidence in government actions.
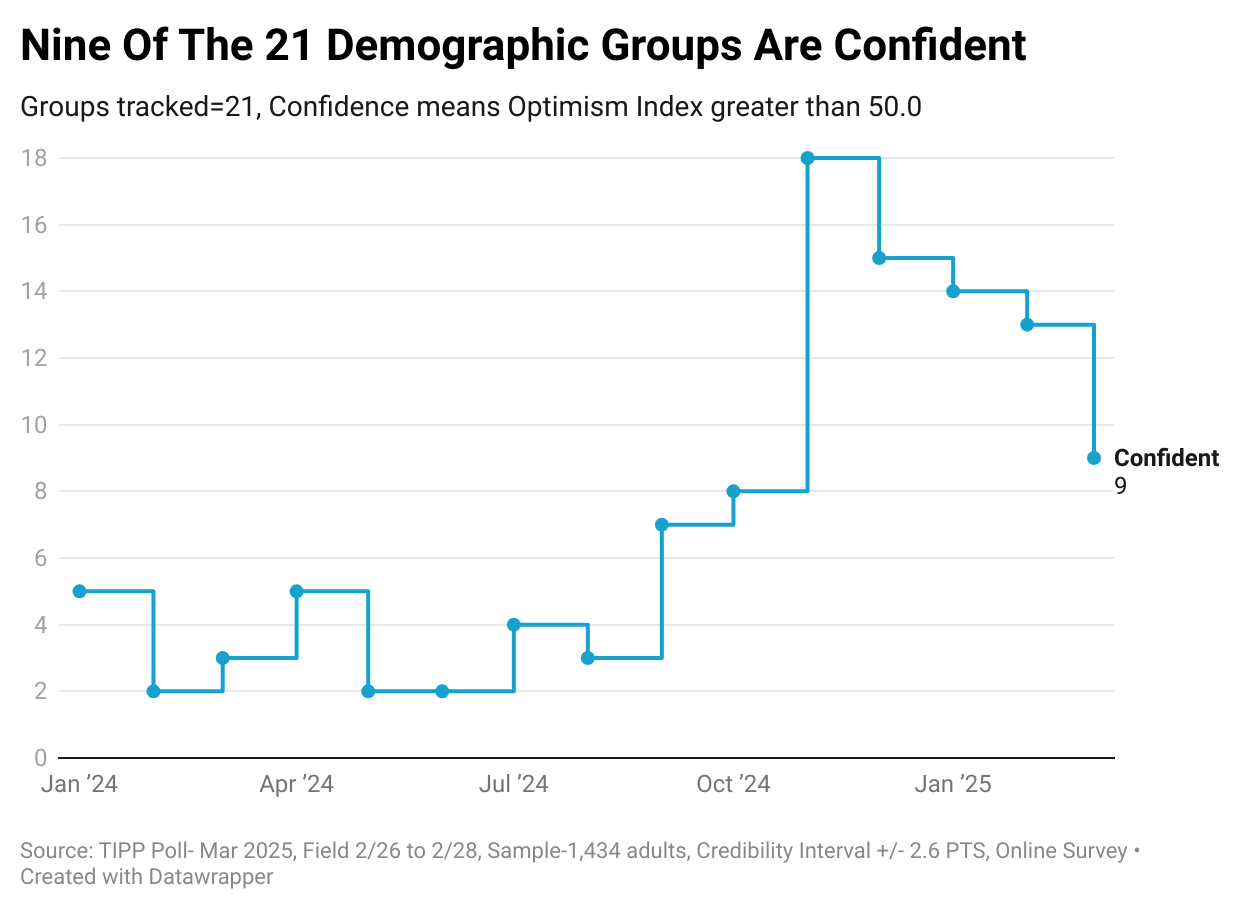
Demographic Analysis
The number of groups in the positive zone indicates the breadth of optimism in American society. This month, demographic groups in the optimism zone fell from 13 in February to 9. In the immediate aftermath of the election, it had jumped from eight in October to 18 in November, indicating widespread optimism.
Five groups improved on the index, compared to 11 in February, five in January, and 10 in December.
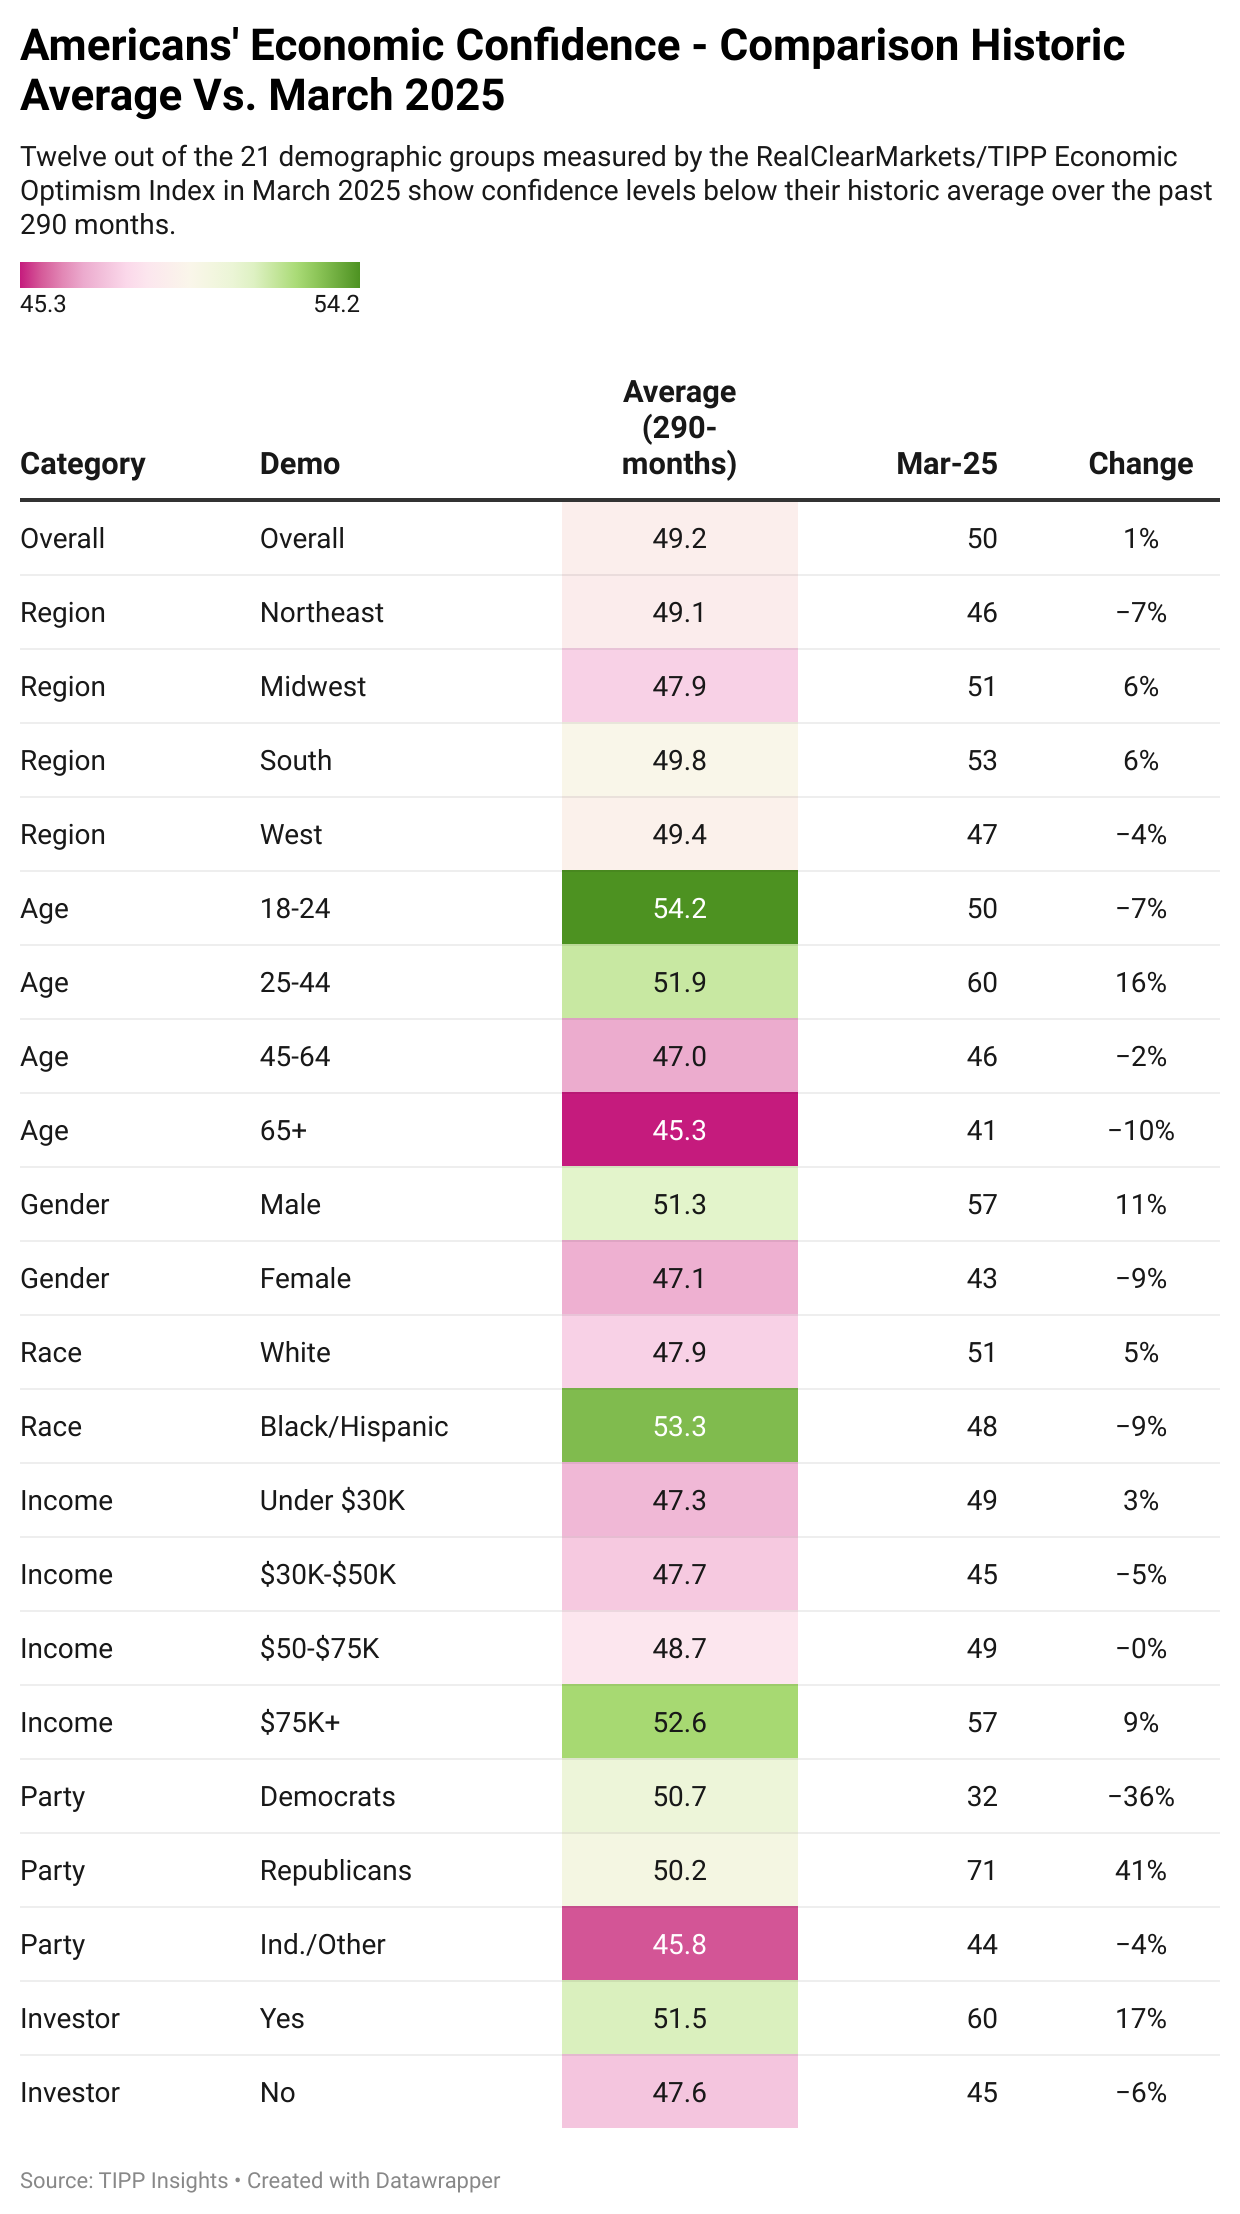
Economic optimism levels for 12 of 21 demographic groups are lower in March 2025 than the historical average of the past 290 months.
RCM/TIPP Financial-Related Stress Index
RCM/TIPP also releases our companion index, known as the RCM/TIPP Financial-Related Stress Index, the only metric to track the financial stress felt by Americans monthly.
The higher the number, the more stress. Readings above 50 signal increased stress, while those below 50 indicate lower stress, with 50 considered neutral.

The Index rose 2.7 points (4.4%) from 61.2 in February to 63.9 in March, reflecting heightened financial stress among Americans.
For context, the last time the Index posted below 50.0 was before the onset of the pandemic in February 2020, when it stood at 48.1. The Index has averaged 60.3 since December 2007. March’s reading of 63.9 exceeds this by 6.0%, signaling heightened financial stress. Notably, the Index peaked at 70.5 in October 2023, marking its highest reading since December 2008 (71.0). Since then, it has declined for the better, reaching 63.9 in March 2025.
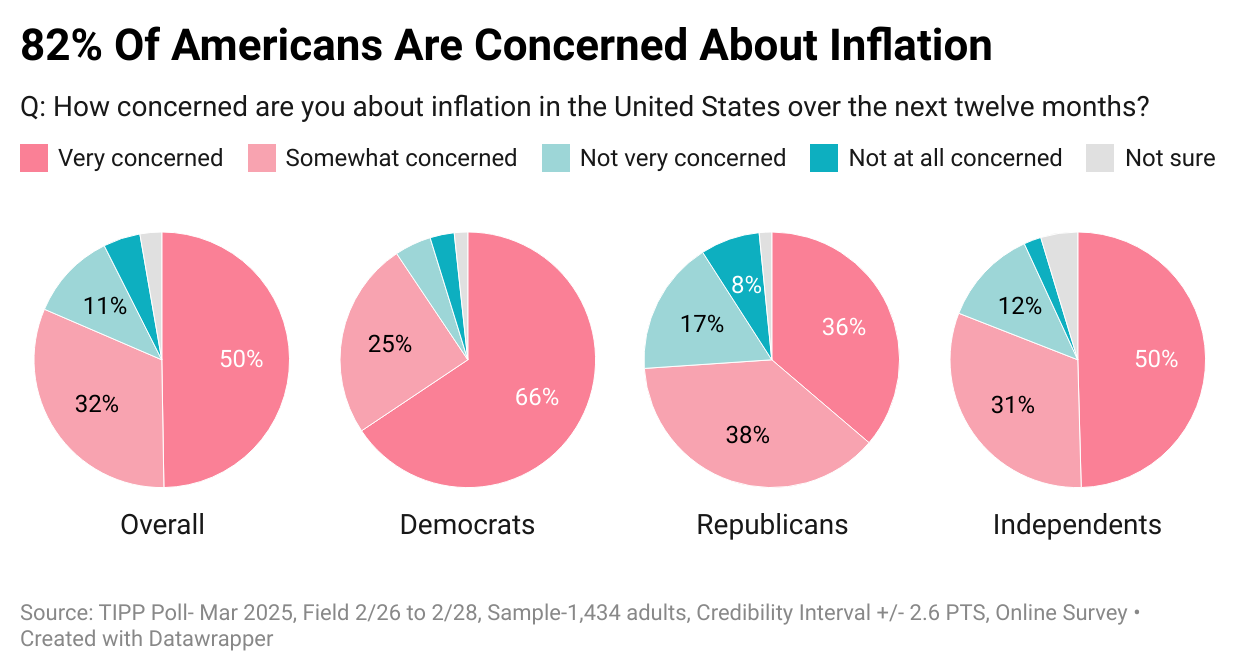
Inflation
The survey showed that 82% are worried about inflation—50% are very concerned, and another 32% are somewhat concerned.
Americans continue to suffer because real wages have not increased, despite the CPI rate falling from a 40-year high of 9.1% in June 2022 to 3.0% in January 2025.

The Federal Reserve believes that long-run inflation of 2%, measured by the annual change in the price index for personal consumption expenditures, is most consistent with its maximum employment and price stability mandate.
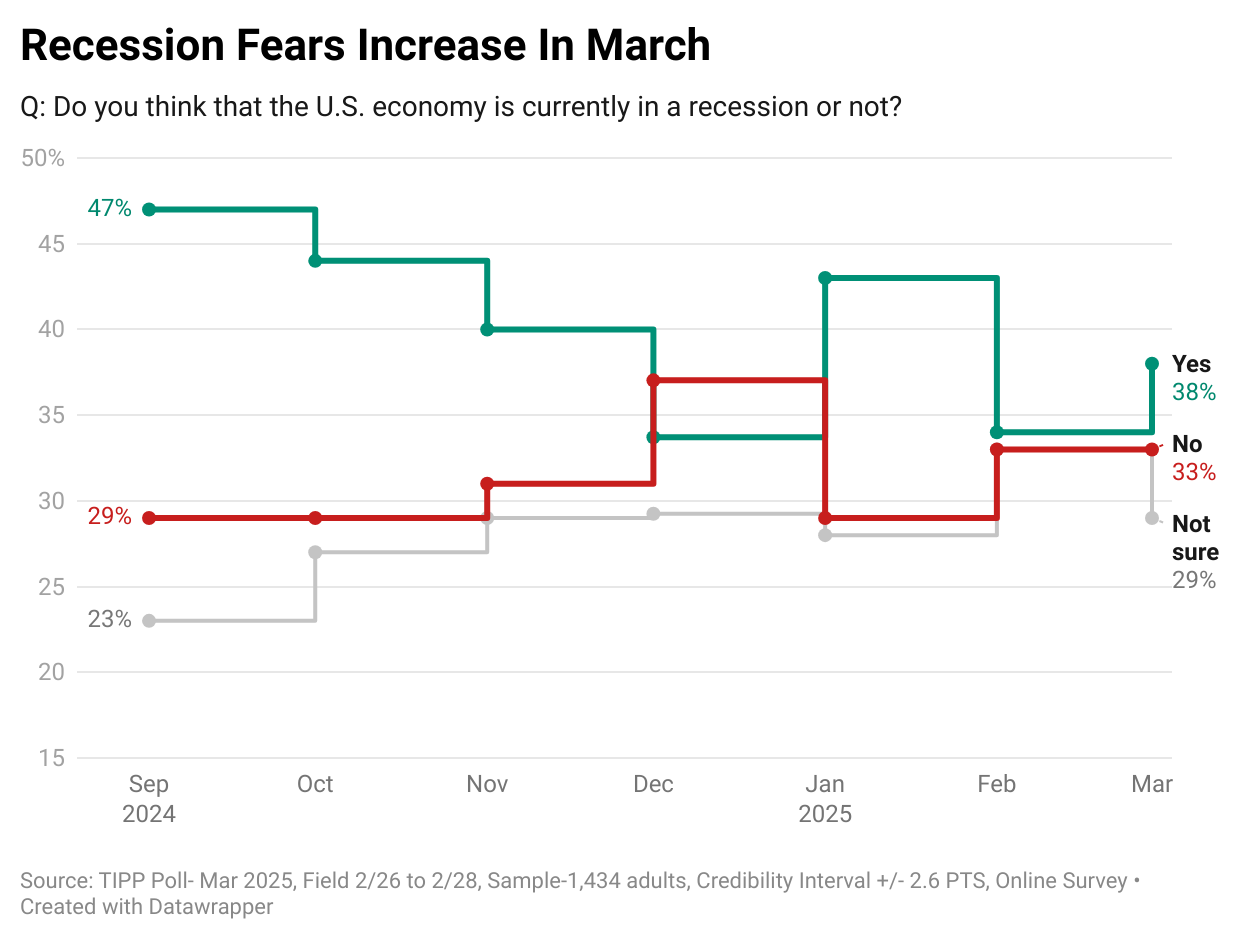
Recession
Over one-third (38%) believe America is in a recession, while 33% think we are not. Another third (29%) are not sure. The share of Americans who have a positive view increased from 27% in November to 35% in March.
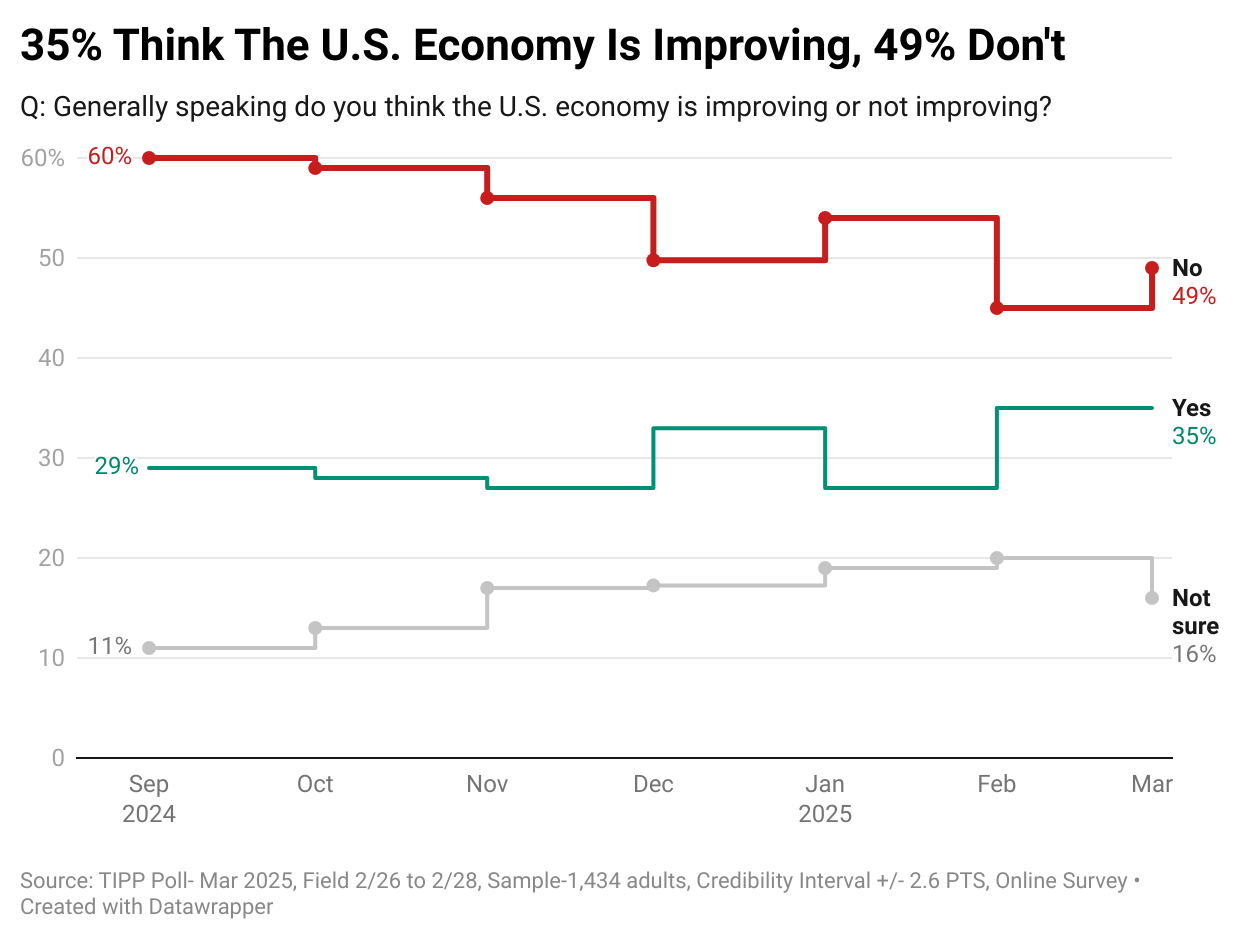
Meanwhile, nearly half (49%) think the U.S. economy is not improving, while 35% believe it is improving. The share of Americans having a positive view increased from 27% in November to 35% in March.
John Tamny, the editor of RealClearMarkets, observed:
It can’t be emphasized enough: consumption is a result of production, and production expands as work is increasingly divided among people and machines worldwide. This is worth remembering as the RCM/TIPP Index retreats. Perhaps we shouldn’t be surprised, given the rise in global trade barriers—with the U.S. playing a regrettable role as an instigator.
Since President Trump’s re-election, economic optimism has largely remained in positive territory, reflecting renewed confidence in his leadership. While Democrats’ sentiment has plummeted, Republicans’ confidence has surged, reaching 71.3 in March. Independent voters initially saw a post-election boost, signaling broader economic hope, though their optimism moderated in March. Confidence in federal policies is steadily improving after years of pessimism. Inflation remains a concern, but more Americans believe the economy is improving, and investor sentiment is strengthening. With Trump at the helm, Americans remain cautiously optimistic about the economic path ahead.