Washington, you have a problem, and elected officials should take note: Regardless of party affiliation, those who elected you no longer have faith in the idea that you actually represent them, the latest I&I/TIPP Poll shows.
It’s no surprise that many voters are turned off by the political class these days. As repeated polls show, voters from both parties agree that the results of recent years from Washington have been less than stellar. And the voters feel Washington is divorced from their everyday concerns.
In the most recent online I&I/TIPP Poll, taken Jan. 4-6 from 1,107 registered voters across the country, we asked voters two questions about their elected officials in Washington.
In the first we asked simply: “In general, do you believe that elected officials in Washington represent MOSTLY the views and values of … ” with the choices being “their constituents,” “Big Donors,” or “not sure.”
The answer was overwhelming and doesn’t bode well for official Washington. Two-thirds (66%) said elected officials represent mostly the views and values of their big donors, not average Americans. Just 16% said they felt their elected officials represented their constituents. Another 18% said they weren’t sure.
When it comes to the politics of those who took the poll, which has a margin of error of +/-3.0 percentage points, this was one of the most uniform responses in I&I/TIPP Poll history.
Among Democrats, 61% said “Big donors,” compared to 68% of Republicans and 73% of independents. “Constituents” garnered 20% of Democrats, 16% of Republicans and just 9% of independents.
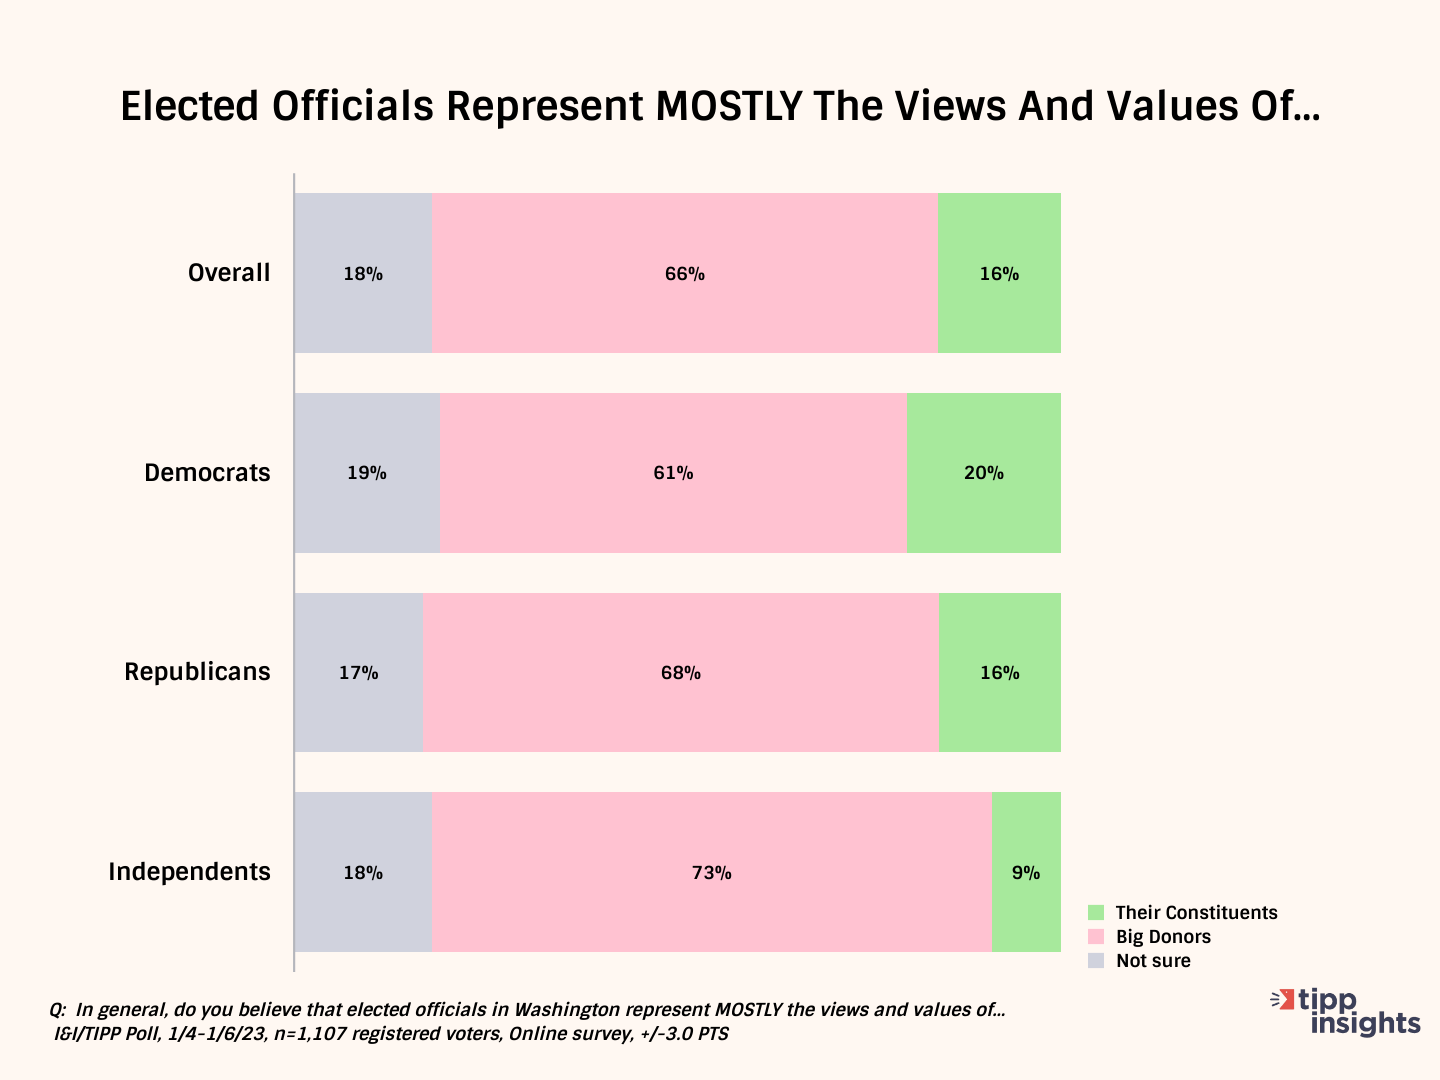
So the political disgruntlement is deep, widespread and multi-partisan.
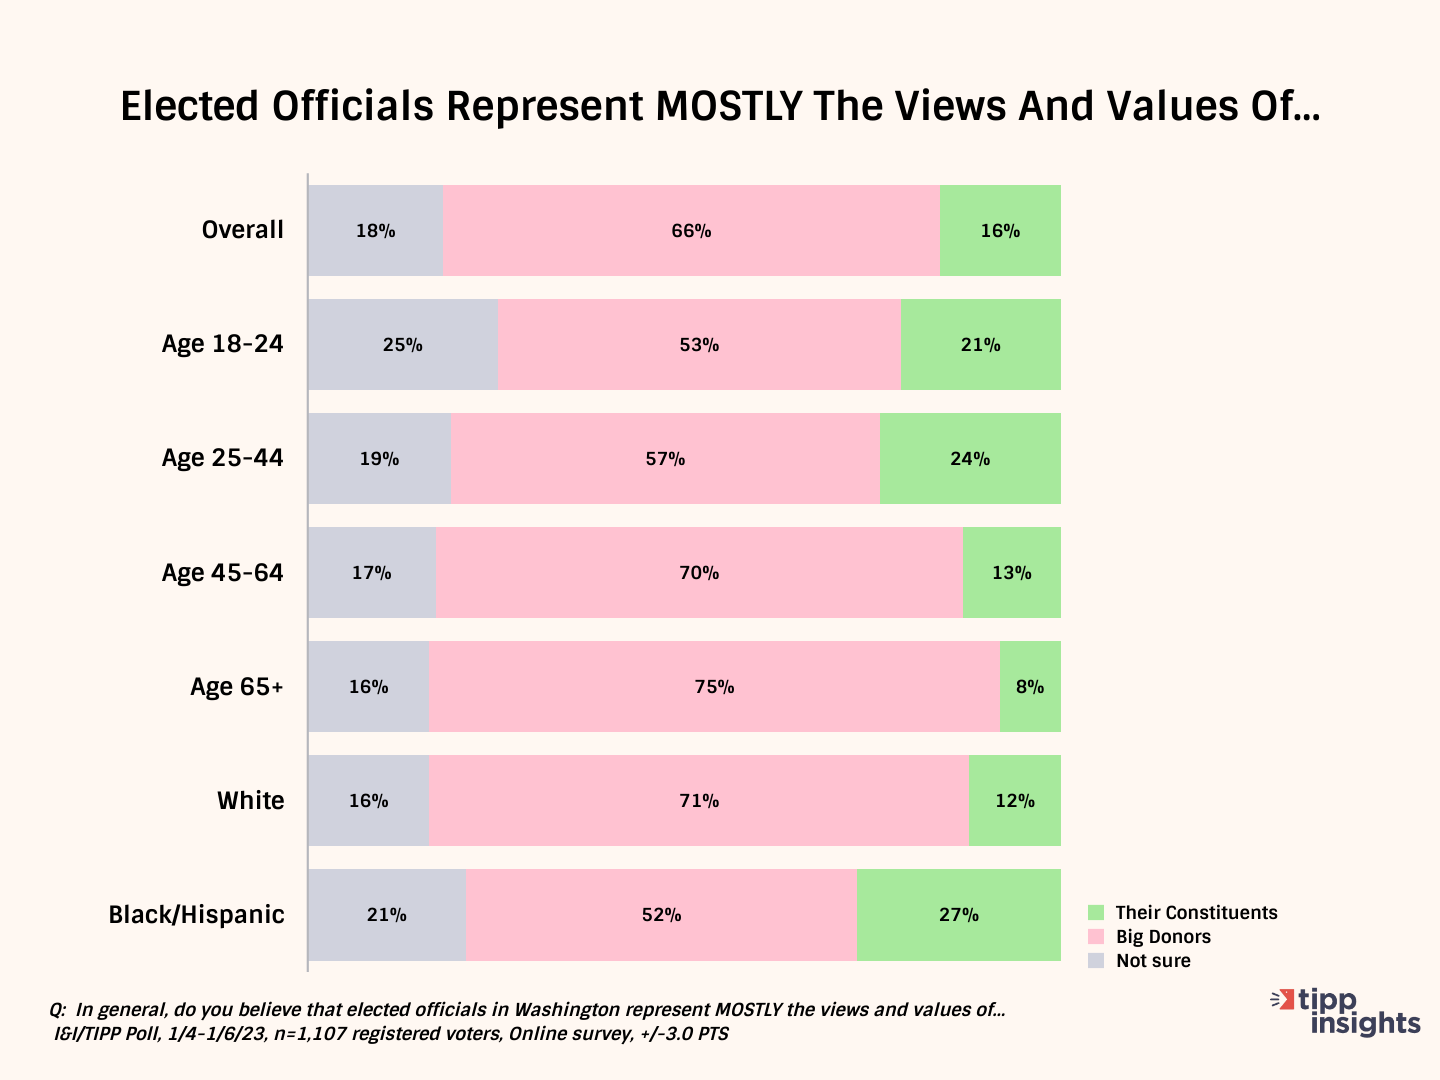
But there were some deeper demographic differences. Most notably, the older the person responding, the more likely they were to believe that their elected officials were really representing the interests and views of those who gave them big bucks.
Among voters from 18-24 years of age, just 53% responded “big donors,” while 21% said “their constituents.” That compares to the 25-44 age group (57% “big donors”, 24% “their constituents”), the 45-64 age group (70% big donors, 13% constituents) and age 65+, the most negative group at 75% “big donors,” compared to a mere 8% for “their constituents.”
The older the voter, the more wary they are of their Washington representatives.
Race was another big difference. Among white voters, 71% said their representatives worked for their big donors, while a tiny 12% said for their constituents. Among black and hispanic Americans, 52% felt their representatives reflected the views and values of their big donors, compared to 27% who responded “their constituents.”
We then asked one more closely related question, reflecting how people felt about their own representatives in Washington: “How satisfied are you that your congressional representative represents your views and values?”
Once again, voters were not happy. Just 39% of Americans said they were satisfied with their congressional representative, while 52% said they were not satisfied.
This time, the political differences showed. Overall, 50% of Democrats called themselves “satisfied,” vs. 43% “dissatisfied,” with their representative. Not so Republicans or independents. For GOP voters, just 36% said they were happy with their representative, 53% unhappy.
By far, independents were least happy: Only 27% declared themselves “satisfied,” compared to a whopping 64% who said they were “dissatisfied.”
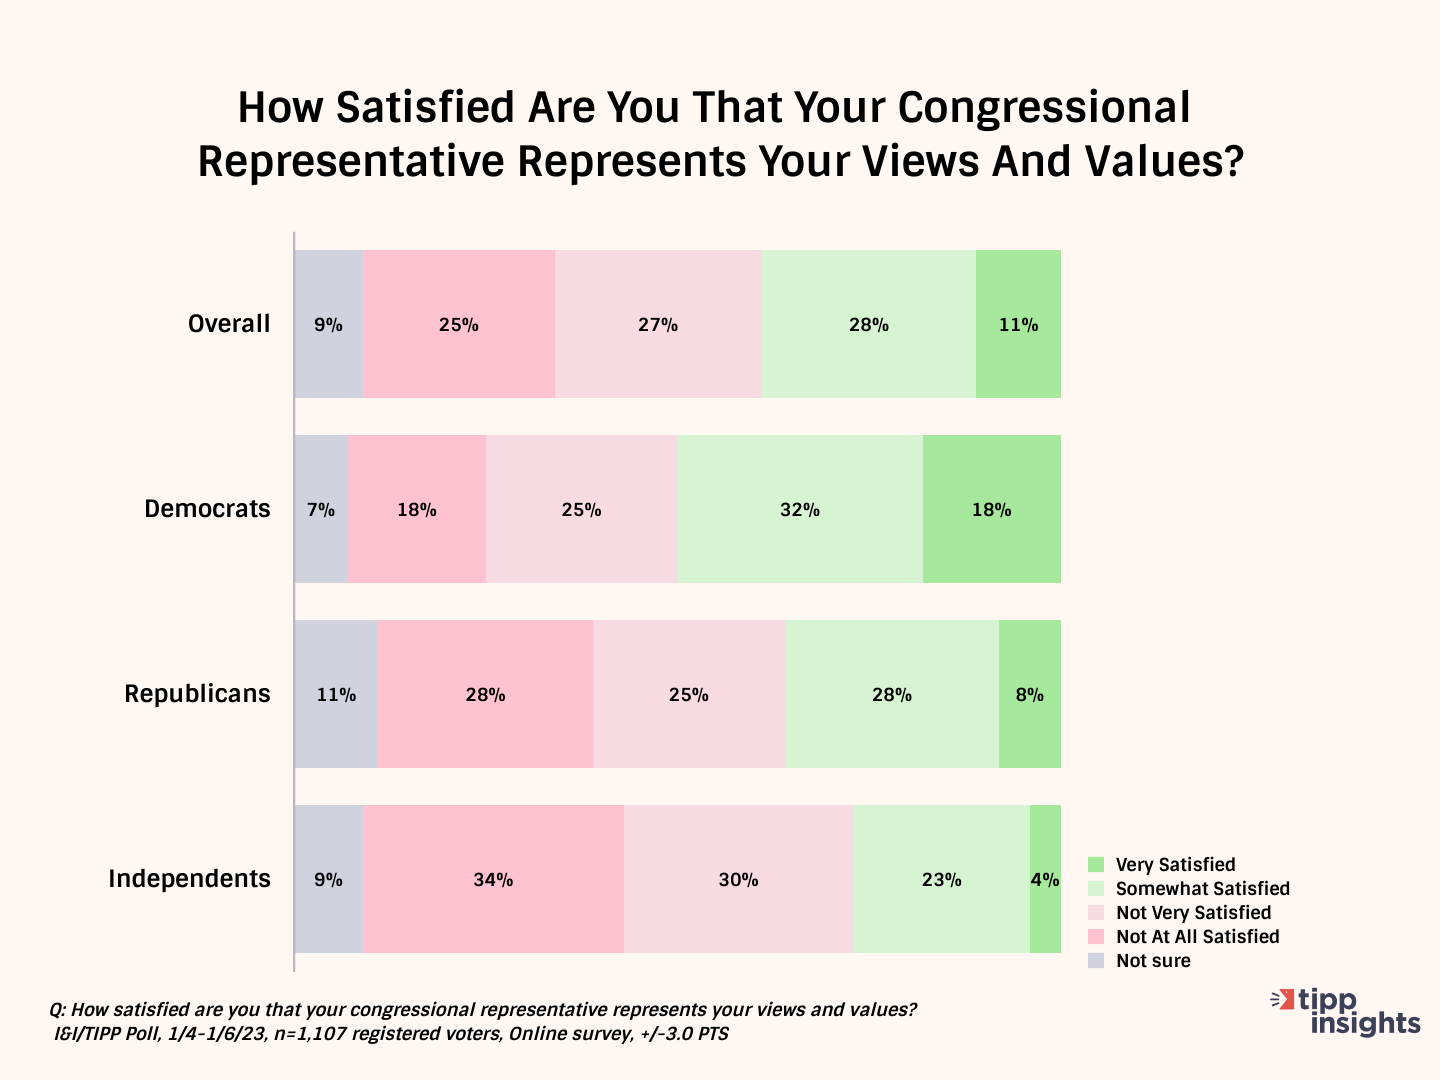
Looking at these numbers, only Democrats feel they’re well-represented in Washington, though it’s still not a majority. Republicans and independents, clearly, have issues with business-as-usual in the nation’s capital.
Both major parties would be wise to pay attention to increasingly restive voters, who see Washington as out of touch and venal, not engaged with average Americans’ problems.
In our earlier December poll, (here and here), voters made their priorities pretty clear. They wanted Congress to focus on the budget and debt, immigration and the border, taxes, energy and abortion, in that order.
When it comes to budget, debt and taxes, recent opinion soundings have not been favorable. A late-December poll of 1.6 million Twitter users asked: “Should Congress approve the $1.7 trillion omnibus spending bill?” Of those responding, 75.4% said no, while 24.6% said yes.
Overwhelming. And yet, the bill was passed by the lame duck Congress and signed by President Biden, who hailed it as a great victory.
Will the new GOP-led House reverse all or part of the huge, unpopular spending bill? It remains to be seen.
On energy, the House leadership has already vowed a “big energy package” early this year that aims to revive domestic fossil fuel production and the mining of critical minerals, with the goal of bringing down energy prices and restoring U.S. energy independence.
As for immigration, fresh reports from U.S. Customs and Border Protection that more than 1.2 million illegal immigrants “got away” since Joe Biden became president are likely to bring back calls for enforcing existing laws regarding illegal entrants across the U.S. border.
“The first half of Biden’s four-year term saw monthly border encounters rise from 36,000 in February 2020 to 251,000 in December 2022, according to CBP stats,” Fox News reported
This has been a key sore spot among voters for years, but has grown since Biden took office, reversing Trump era policies and following what has been, in effect, an open-border policy.
Republican leadership in the 118th Congress also pledge to form a “Select Subcommittee on the Weaponization of the Federal Government,” and possibly several other panels, to look into the growing reach of the federal government into Americans’ lives, with special emphasis on intelligence agencies, the Justice Department, and politicized Jan. 6 hearings held by the Democrats in the last Congress.
That includes looking into possible FBI and CIA misconduct or even crimes in interfering with two presidential elections, their pushing the false Donald Trump “Russian collusion” line on social media, raiding Trump’s Mar-A-Lago home, and secretly “collaborating” with social media to restrict free speech by banning those whose ideas run contrary to the left-leaning media giants.
Then there’s growing evidence of possible criminal corruption within the Biden family, as revealed by the tawdry saga of son Hunter’s lost-and-found laptop. Alarming evidence that President Biden, while vice president and senator, took money from influential Chinese, Ukrainian and Russian officials has become overwhelming. It will be the House’s job to hold hearings.
Can swift action on energy, taxes and spending, and immigration help restore voter confidence. Will hearings on misconduct by government officials restore Washington’s lost luster?
It remains to be seen. But as the I&I/TIPP Poll shows, many Americans increasingly believe big government at the federal level no longer listens to average people or shares their views. That’s dangerous for any elected government.
I&I/TIPP publishes timely, unique and informative data each month on topics of public interest. TIPP reputation for polling excellence comes from being the most accurate pollster for the past five presidential elections.
Terry Jones is an editor of Issues & Insights. His four decades of journalism experience include serving as national issues editor, economics editor, and editorial page editor for Investor’s Business Daily.
Hey, want to dig deeper? Download data from our store for free!
Please email [email protected]
Republished with permission from TIPP Insights